Economic 'Melt Up'
- Posted on December 18, 2019
- Financial Terms
- By admin

A melt-up is a dramatic and
unexpected improvement in the investment performance of a class of an asset,
which is partly driven by a rush of investors who do not want to miss out on
its rise, rather than by fundamental improvements in the economy. The profit
created by 'melt up' are considered to be unreliable indications of the
direction the market is ultimately headed. According to some reviews, melt ups
often precedes melt downs.
When
the stock market "melts down",
major market indexes tank and is usually triggered by some sort of geopolitical
event for example wars, terrorist attack, and so on; or the beginning of an economic
downturn like recession, depression and more. An economic 'melt up' is the
antonym of an economic 'melt down' and is usually triggered by a decrease in interest
rates, strong earnings reports from top companies as well as economic recovery.
In the case of an economic 'melt up' the first thing investors usually think
about is how to buy stocks first. In the case of major stock market indexes, an
economic 'melt up' can result in an increase ranging from 20% to over a 100%
which is quite higher than normal.
According
to historical review, financial analysts saw the 'run up' in the stock market
at the beginning of 2010 as a possible 'melt up' because unemployment rate was
on the increase, commercial and residential real estate values also suffered
and retail stock investors continued to pull their cash out of the stock
market. Another example of economic 'melt up' is the Great Depression of
1929-1932.
Focusing on
fundamental factors and ignoring economic 'melt ups' usually begins with having
a strong insight of economic indicators, which could come in the form of
leading indicators or lagging indicators. These indicators usually gives an
investor the opportunity to forecast the direction the stock market is likely
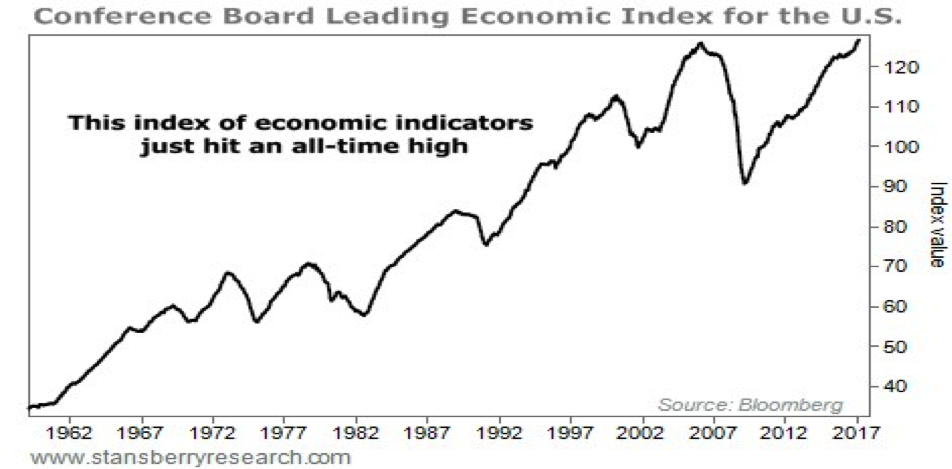
to follow and overall health of the economy. Leading
indicators are factors that will usually shift before the economy starts to
follow a particular pattern. An example is the Consumer Confidence Index (CCI),
which is a leading indicator that reflects consumer perceptions and attitudes
like how they spend and money sufficiency. A rise or fall of this index gives a
strong indication of the future level of consumer spending, which accounts for
70% of the economy.
Lagging
indicators usually shift only after the economy has begun to follow a particular
pattern. These technical indicators trail the price movements of their
underlying assets. Examples of
lagging indicators are the moving averages and a host of others.
Many
investors try to avoid economic 'melt ups' and the impact on their emotions
when gambling rather than focusing on the fundamentals of companies.


Be the first to comment!
You must login to comment